Why Financial Transformation Logic Belongs in dbt, Not Power BI.
.png)
Audio Highlights
This component uses custom JavaScript to open and close. Custom attributes and additional custom JavaScript is added to this component to make it accessible.
Video Highlights
This component uses custom JavaScript to open and close. Custom attributes and additional custom JavaScript is added to this component to make it accessible.
Power BI is excellent at what it was designed for: connecting to data, building dashboards, and putting self-service analytics in the hands of business users. For financial reporting teams, it has become indispensable.
The problem is what accumulates inside it over time. Account hierarchies, fiscal period logic, cost allocation rules, budget-to-actual calculations - all this business logic ends up embedded in DAX measures, calculated columns, Power Query steps, and Excel-based mapping tables loaded into the model. Each piece was added to solve a real problem. Collectively, they turn Power BI into a transformation layer it was never built to be.
dbt (Data Build Tool) is an open-source transformation framework that executes SQL queries directly within a cloud data warehouse: Snowflake, BigQuery, Databricks and more. It applies software development principles, such as version control, automated testing, documentation and modularity, to the layer where financial logic actually belongs - between the source systems and the reporting tools.
Transitioning transformation logic from Power BI to dbt does not eliminate the need for Power BI. It improves Power BI, making it simpler, faster, and more reliable.
What Happens When Transformation Logic Lives in Power BI
In a typical financial reporting environment, transformation logic accumulates across several layers of the Power BI model:
- DAX measures encoding business rules: gross margin definitions, variance calculations, year-to-date accumulations
- Calculated columns for data shaping: concatenated keys, classification flags, display labels, custom sort orders
- Power Query steps: filtering, joining, and reshaping data arriving from source systems into a structure more optimized for reports and analysis.
- Mapping tables loaded from Excel to assign account codes to P&L lines, Cost Centers to business units, or entities to reporting segments
- Helper and bridge tables compensating for missing joins or structural gaps in the source data
For financial reporting specifically, this creates four problems that compound over time:
- No audit trail: When a measure or transformation changes, there is no record of what it was, who modified it, or why. For financial reporting subject to internal controls, this creates a significant governance gap
- Logic is untestable: Errors often appear directly in reports seen by stakeholders instead of being caught through proper testing before deployment
- Performance suffers: Power Query transformations execute within Power BI infrastructure rather than in the data warehouse where the data resides, leading to inefficiencies
- Logic cannot be shared: Reusable logic, such as fiscal period calculations or account hierarchies, becomes locked inside a single model and must be rebuilt from scratch in every other model that requires it
How dbt Works and Why It Fits Financial Reporting
At its core, dbt is straightforward: it takes SQL files, resolves the dependencies between them, and runs them in the right order inside the data warehouse.
Each file is a model - a SELECT statement that produces a table or view.
The warehouse performs computations, with dbt providing the necessary structure, governance, and automation. That simplicity can be misleading. What makes dbt powerful for reporting environments is how it structures, manages, and governs those SQL files.
Layered Models: A Clear Pipeline from Source to Report
dbt projects are organised into layers, each with a distinct responsibility. The exact structure adapts to the needs of the project - the layers can be merged, renamed, or extended depending on the complexity of the data environment- but most teams follow a similar pattern because it scales well and keeps logic easy to navigate.
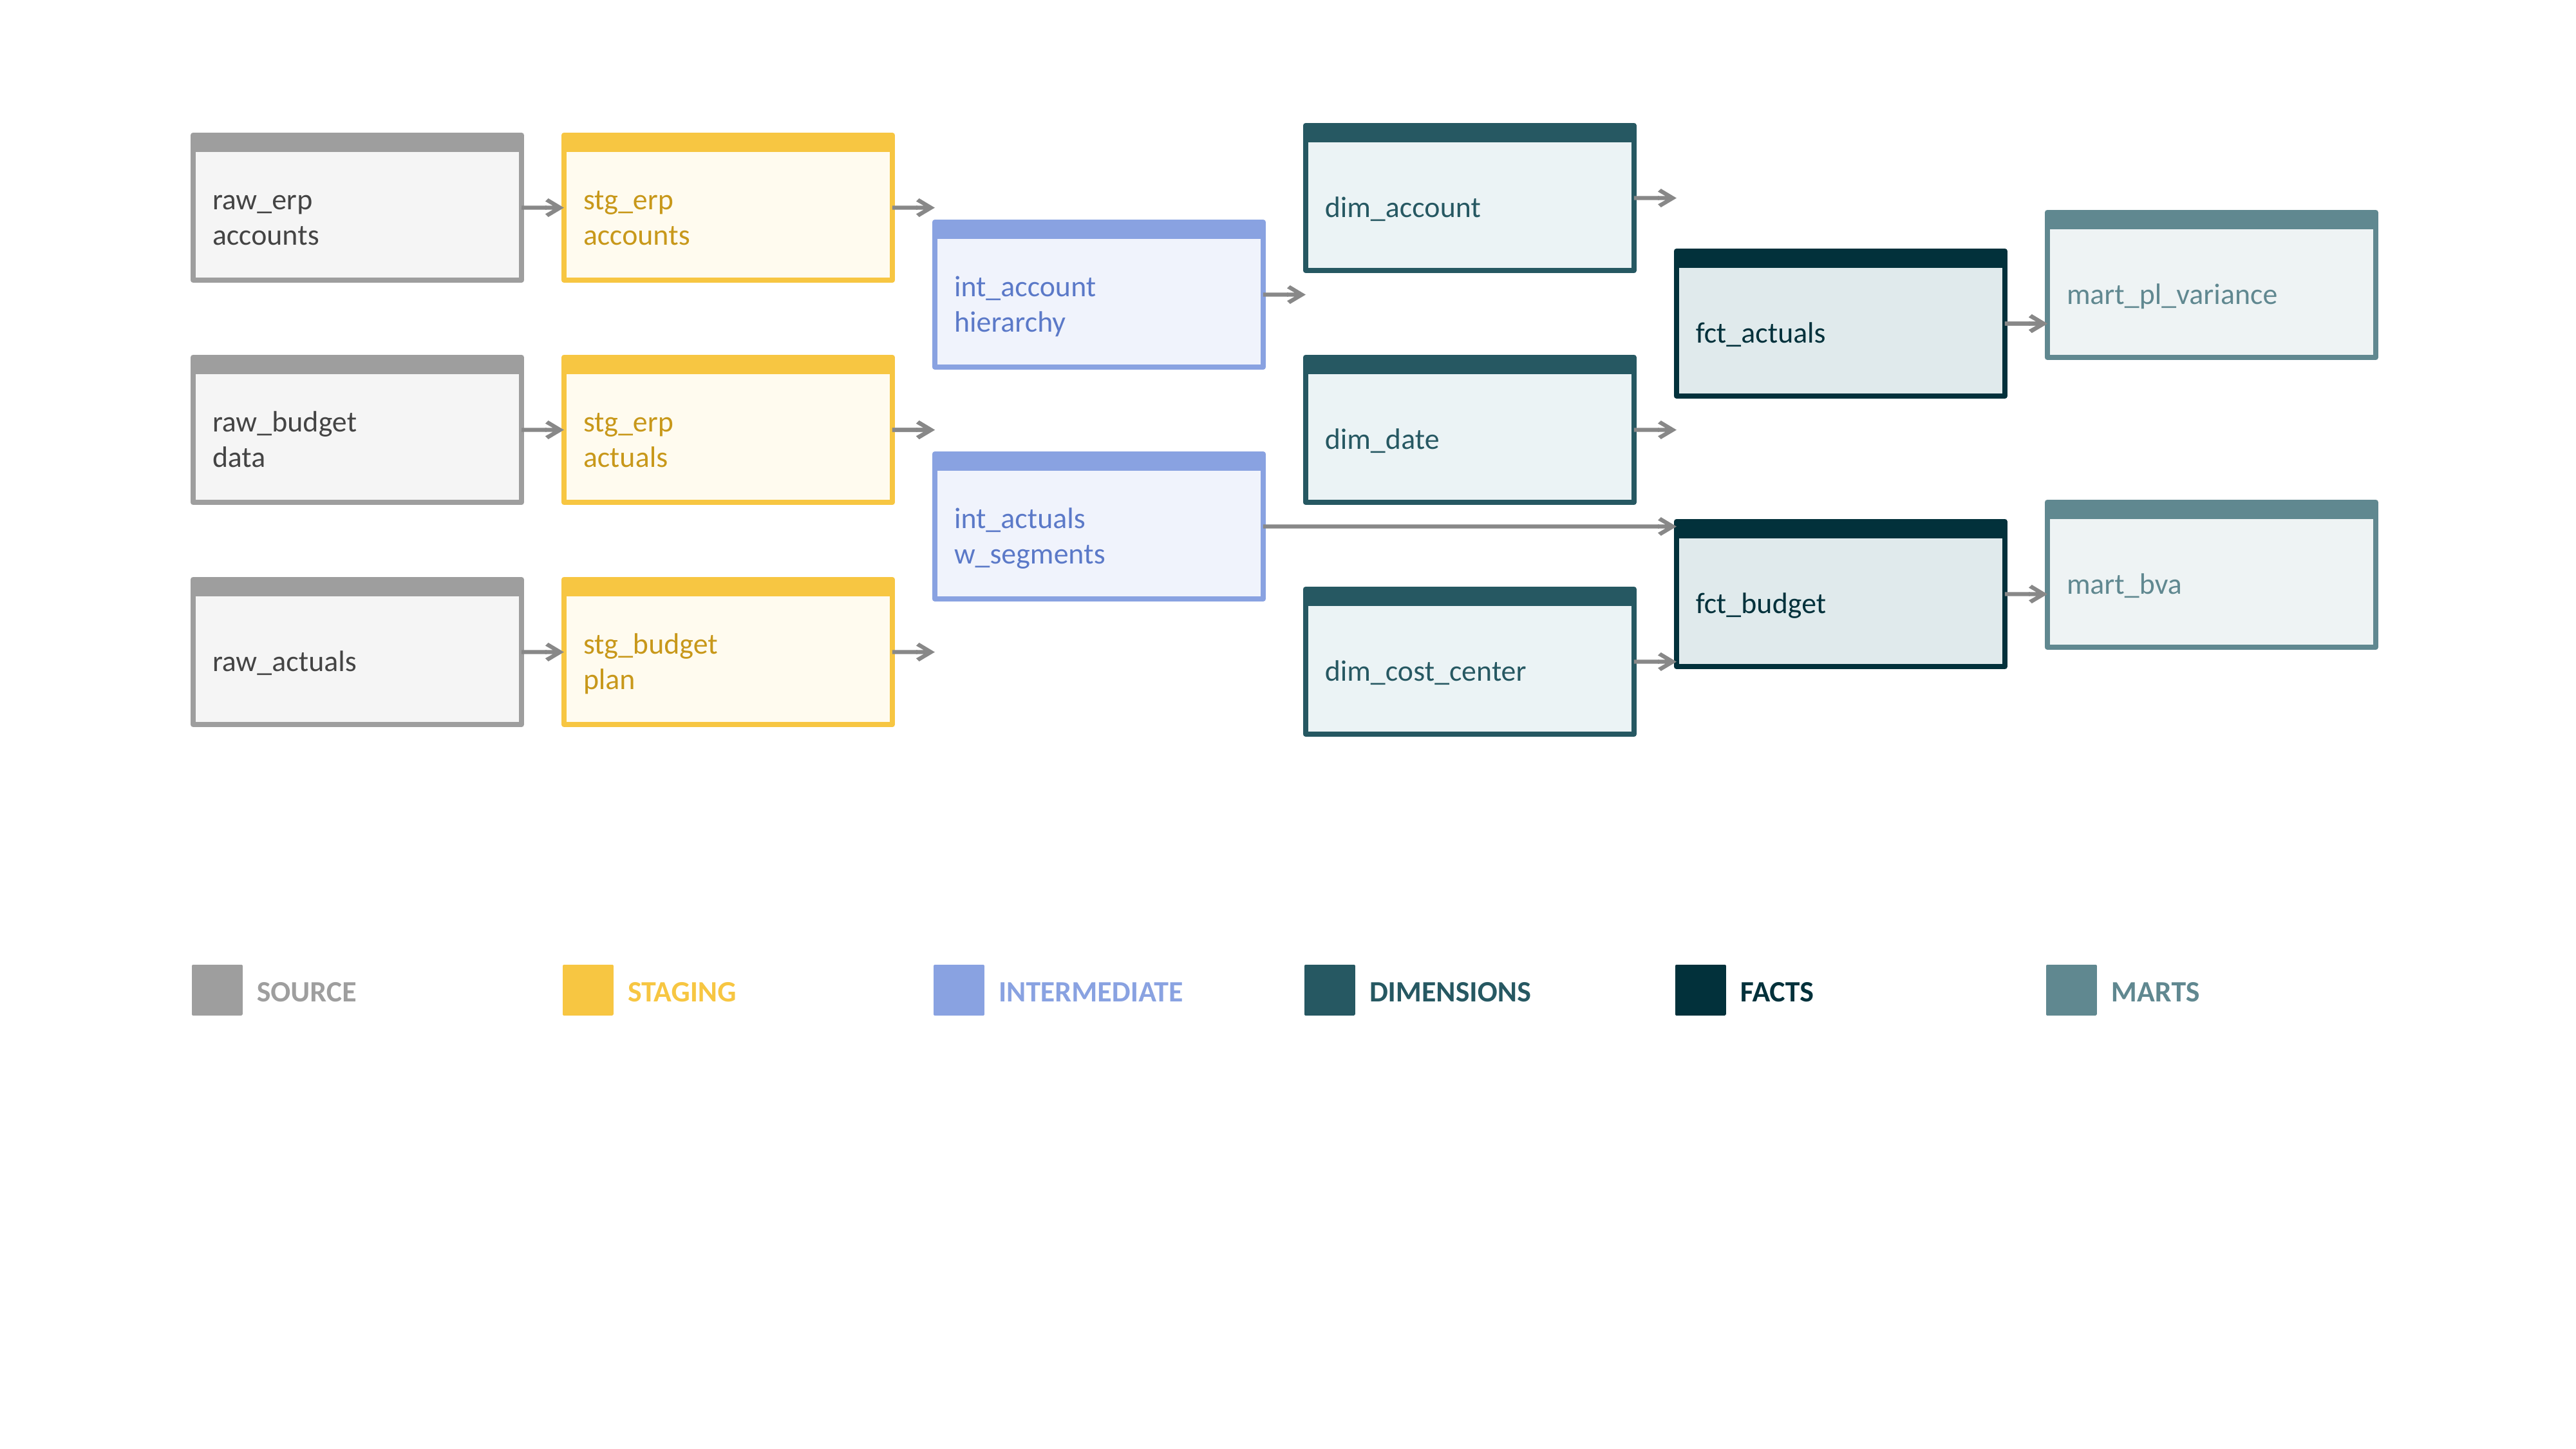
In a typical financial reporting setup, staging models clean and standardize raw data from source systems without applying any business rules. Intermediate models join and reshape staged data, applying logic like cost allocations or segment assignments. Dimension models produce the reusable reference tables that everything else joins to - accounts, cost centers, organizational hierarchies, date periods. Fact models hold the grain-level financial data. Mart models are the report-ready outputs, such as a pre-aggregated P&L view, a budget variance summary, or a headcount report by cost center.
Each model references others using a ref() function, which builds the full dependency graph automatically and forms the foundation of dbt's data lineage capability.
The lineage map is directly useful for financial reporting. When an auditor asks how a P&L figure was derived, the answer is a diagram rather than a developer's memory. When a source system field changes, the lineage graph immediately shows every downstream model and report affected by that change. This makes impact assessment a matter of seconds, rather than a manual search. And when a number looks wrong, the lineage makes it possible to trace the discrepancy back to the exact transformation step where it was introduced.
In environments subject to audit or financial controls, traceability is a governance requirement that most Power BI-centric architecture cannot currently meet.
Illustrating dbt Lineage: An Example Financial Reporting Pipeline
Version Control: Every Change Has an Author and a Reason
dbt models are plain SQL files, so they live in a code repository like Git. Every change to a transformation is a commit: who made it, when, what changed, and why. Rolling back on a change that introduced an error is a single command.
This is a significant governance improvement in financial reporting. When a measure of definition changes before a board presentation, or a cost allocation rule is quietly adjusted during month-end close, there is a record. This meets the audit evidence standard that financial controls require- something that Power Query and DAX changes have never been able to provide.
Automated Testing: Errors Caught Before They Reach Reports
dbt has a built-in testing framework that runs every time models are built. It checks uniqueness, non-null constraints, and referential integrity by default. For example, every cost center in a fact table has to exist in the cost center dimension.
But it also supports custom SQL tests that encode financial business rules directly. In practice, this allows key financial control rules to be automated and continuously validated, for example:
- Cost allocations must sum to 100% per entity- ensuring that distributed costs are fully accounted for, and nothing is over- or under-allocated.
- Accounts belong to only one P&L segment- preventing the same account from appearing in multiple reporting categories.
- Actuals for closed periods must not change- protecting historical financial results from accidental updates.
- Headcount records must reference an active department or cost center - avoiding orphaned records in HR or payroll data.
When implemented as automated tests, these rules run every time the pipeline executes, catching issues immediately instead of allowing them to surface later in reports.
Seeds: Version-Controlled Reference Data Owned by Finance
Most financial reporting environments have reference data that finance teams maintain outside the source systems. These include account-to-P&L-line mappings, cost center hierarchies, custom segment groupings, and FX rate overrides. These typically live in Excel files, loaded into Power BI via Power Query, with no audit trail or change history.
dbt handles these as seed files - CSV files stored in the same repository as the SQL models. Finance teams can continue editing them in a spreadsheet; the file is committed to the repository on each update. Every change is versioned, every version is recoverable, and the mapping is applied consistently to every model that references it.
What Moves from Power BI to dbt
Almost everything currently living in Power Query and calculated columns has a natural home in dbt. The table below shows the most common patterns:
.png)
DAX does not disappear entirely. Report-specific calculations, visual formatting logic, and interactive analysis that depends on user selections remain in Power BI - where DAX genuinely excels. The shift is about moving the stable, reusable business logic upstream, not eliminating Power BI's calculation capability.
How to Start
A migration does not require rebuilding everything at once. The most effective approach is incremental - starting where the return is highest and the risk is lowest.
Begin by mapping what currently lives in Power Query and calculated columns that have nothing to do with visualization. These are the clearest candidates to move first and migrating them simplifies the Power BI model immediately.
Work outward from source data cleanup - standardizing formats, resolving naming inconsistencies, filtering out inactive records- through the core financial dimensions such as date tables, account hierarchies, and organizational structures, and then on to the business rule calculations that are currently duplicated or need to remain consistent across multiple reports. Build the corresponding dbt models at each stage, connect Power BI to the new warehouse tables, and retire the Power Query steps as you go. With each step, the Power BI model becomes simpler while the underlying data becomes more structured, governed, and reliable.
Not sure where your transformation logic should live? Let's map it out together.
The Result: Two Tools Doing What They Were Built For
When transformation logic moves to dbt, Power BI becomes a more reliable and maintainable reporting platform. Reports connect to pre-modeled, tested data rather than performing transformations themselves. The finance team gets the audit trail and governance that financial reporting has always required. Developers spend less time debugging inconsistencies and more time building things that matter.
The division is straightforward: dbt owns the data model - the definitions, the structure, the quality rules, the transformation logic. Power BI owns the reporting layer- the dashboards, the interactivity, the self-service experience. Each tool does what it was designed for, and the result is a financial reporting architecture that is more reliable, more auditable, and significantly easier to maintain.
Meet the authors

-WB.JPG)

.png)
.png)


.png)
.png)


.png)


.png)